.

● Using the Dynamic Query Tool to Create a Query |
To collect data using the Dynamic Query Tool
1. On the Dynamic
Query Tool page, click Add New.
.
2. Complete the following fields:
a. Report Name: Enter a descriptive name for the report.
b. Description: Enter a description of the report.
c. Root Table: Select the type of data you want to extract:
Note: You can include the VAT number in several root tables (e.g., the Users and Contact root tables). For more information on the VAT taxation model, see VAT Taxation Model.
● Orders
● Users
● Operator View
● Inventory
● Output Devices
● Accounting Codes
● Spending Account
● Order Invoice
● Order Approvals
● Digital Download Orders
● Production PDF Orders
● Copyrighted pages
Note:
The default Root Table—Orders—is
all-inclusive and lists all available data in the Table Tree. To narrow
the scope of data to extract, select one of the other options, then click
the display icon ![]() to add columns
to the Design Mode.
to add columns
to the Design Mode.
Note: For a complete reference guide to all items in the Table Tree see the Dynamic Query Tool Reference.
3. After selecting
Root Table data, click the display
icon ![]() to add columns to the Design Mode for the query.
to add columns to the Design Mode for the query.
4. In the Table Tree, check the boxes for each data type you want to include in the query. These will be column headers in your query.
Note: Example: If you want to create a simple order report, select Orders in the Root Table field. Then you might select the following data in the Table Tree, each of which will populate a column in the report:
—Order —Order Status —Total Cost —Order Date —Order Due Date —Contacts —First Name —Last Name —Payment Methods —Payment Method —Inventory —Catalog Name —Delivery Method —Shipping Method |
|
5. Click ![]() to populate the Design Mode grid
with your selections.
to populate the Design Mode grid
with your selections.
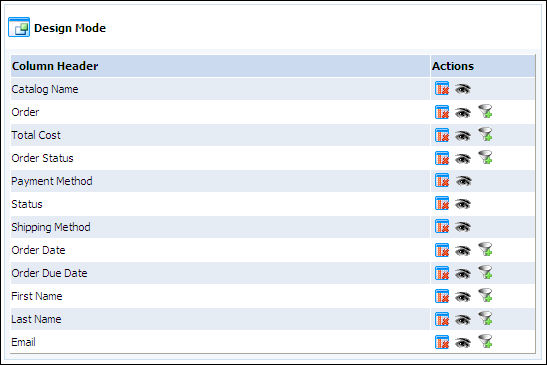
6. To rearrange the order in which the columns are displayed in your report:
● Position the cursor over the move icon on the row you want to reposition. ● Left-click on the row you want to reorder in the list and keep the mouse button depressed. ● Without releasing the mouse, drag the mouse onto the row you want it to occupy. Note: Dragging a row up will move it to the left in the report; dragging it down will move it to the right in the report. So moving a row to the top of the list will cause it to be the first column in the report. ● Release the mouse button. |
|
Note:
The following actions are available for each column header:
![]() — Removes the column from the report.
— Removes the column from the report.
![]() — Shows/hides the column in the report viewer and in
the downloaded report.
— Shows/hides the column in the report viewer and in
the downloaded report.
![]() — Adds a filter to the selected column header. For more
information on using report filters, see Using
Report Filters with the Dynamic Query Tool.
— Adds a filter to the selected column header. For more
information on using report filters, see Using
Report Filters with the Dynamic Query Tool.
7. Click Save.
Note:
—To apply filters
to your report, see Using
Report Filters with the Dynamic Query Tool.
—To export
and download your report so that you can format the data in a database
or spreadsheet application, see Viewing
& Downloading Data with the Dynamic Query Tool.
Report Filters enable you to further narrow the scope of data to include in your report. They let you “drill down” to extract just the information you need for reporting purposes. For example, if you filter the data based on Order Date, you can limit your report to orders placed within a specified date range.
To add a filter with the Dynamic Query Tool
1. Go to Administration > Dynamic Query Tool.
2. Click the report name in the grid.
3. On the Dynamic
Query Tool page, click the filter icon ![]() .
.
Note:
Not all column header data
will have conditions to filter, which is why the filter option does not
appear on all header rows in the designer.
Clicking the filter
icon ![]() causes the filter conditions
panel for that data to open in the Report
Filters section.
The conditions (i.e., configurable options) available will vary based
on the column header data you have chosen to filter.
causes the filter conditions
panel for that data to open in the Report
Filters section.
The conditions (i.e., configurable options) available will vary based
on the column header data you have chosen to filter.
4. Click Update
Filter in the Report Filters
section.
5. Click Save.
6. Click View Report.
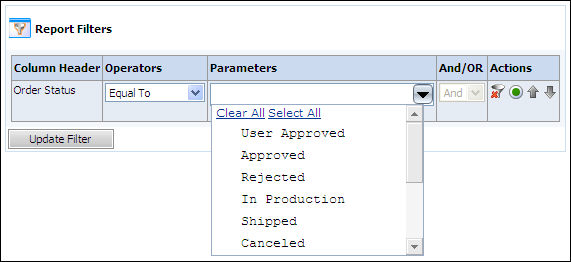
7. Configure the filter
to define the scope of data in your report:
Note: Clicking the filter icon causes the filter conditions panel for that data to open in the Report Filters section. The conditions (i.e., configurable options) available will vary based on the column header data you have chosen to filter.
a. Column Header: Name of the column header-level data you are filtering.
b. Operators: Limiters such as Less Than, Equal To, Greater Than; Equal To, In, Not In; Between; a date range; etc. Operators vary by data type.
c. Parameters: The value you want to isolate for the data.
Note: For example, if you are filtering the report data by Order Status and want to limit your report to orders that have already shipped, you would select Operators : Equal To and Parameters : Shipped from the pull-down list in the Parameters field.
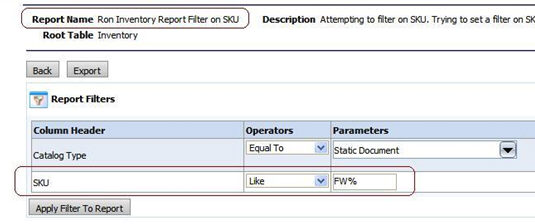
Note: To filter results of searches
using the Dynamic Query Tool, use the % sign with the LIKE operator to
run wildcard searches. The % sign combined with the LIKE operator functions
as a wildcard (i.e., rather than the *). For instance: If you wanted to
find all SKUs in the system containing the letters FW anywhere in the
SKU, you would set the filter as:
SKU LIKE %FW%
This will display all SKUs that contain the letter combination FW anywhere
in the SKU ID (see image below). To display all SKUs prefixed (that begin
with) FW, you would set the filter as:
SKU LIKE FW%
To display all SKUs postfixed (that end with) FW, you would set the filter
as:
SKU LIKE %FW
● And/OR: If you are using two or more filters in your report, you can run both (or all) by selecting And in each column header; selecting OR will run the
● Actions:
● ![]() Removes the report filter.
Removes the report filter.
● ![]() Makes the filter editable or uneditable in the Report
Viewer.
Makes the filter editable or uneditable in the Report
Viewer.
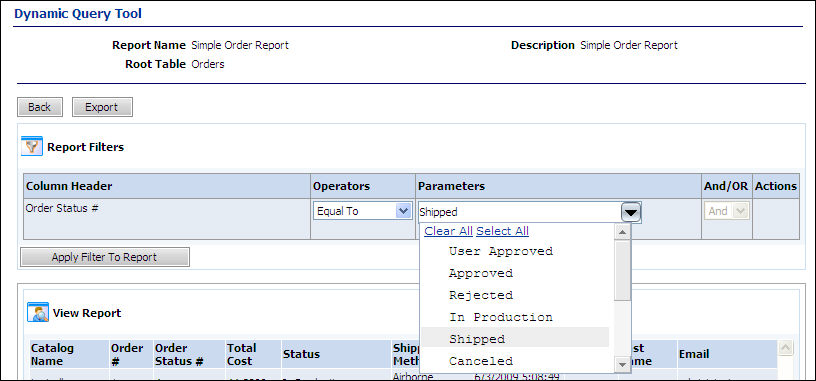
Note:
For instance, if you wanted
the report only (and always) to yield data on the orders in the “Shipped”
order status, you would select “Shipped” from the Parameters
pull-down list then click
the Editable icon
![]() to switch it to uneditable
to switch it to uneditable ![]() .
This will prevent the order status from being changed in the report (i.e.,
the field will be grayed out in the Report Viewer).
.
This will prevent the order status from being changed in the report (i.e.,
the field will be grayed out in the Report Viewer).
● ![]() Moves the filter up or down in the filter list.
Moves the filter up or down in the filter list.
8. Click Apply Filter To Report to update the View Report grid on the page with your filters applied.
9. Click Export to prepare the report for download.
10. On the File Download dialog, click Save, choose the folder in which to save the report, give the report a new name in the File Name field if you wish, then click Save.
11. Click Back to return to the previous page.
Note: You can now open the exported data (in .cvs format) in your database or spreadsheet application of choice to format the data and perform calculations, etc.
1. Go to Administration > Dynamic Query Tool.
2. Follow the instructions in Viewing and Downloading Data with the Dynamic Query Tool.
● Dynamic Query Tool Reference
● Reports

